Statistical Platform for Analysis, Research and Knowledge
Statistics for life-science research, without the weight.
SPARK is a lightweight tool for running the tests your research needs and turning them into clean, publication-ready graphs. Paste your data, pick a test, get your answer.
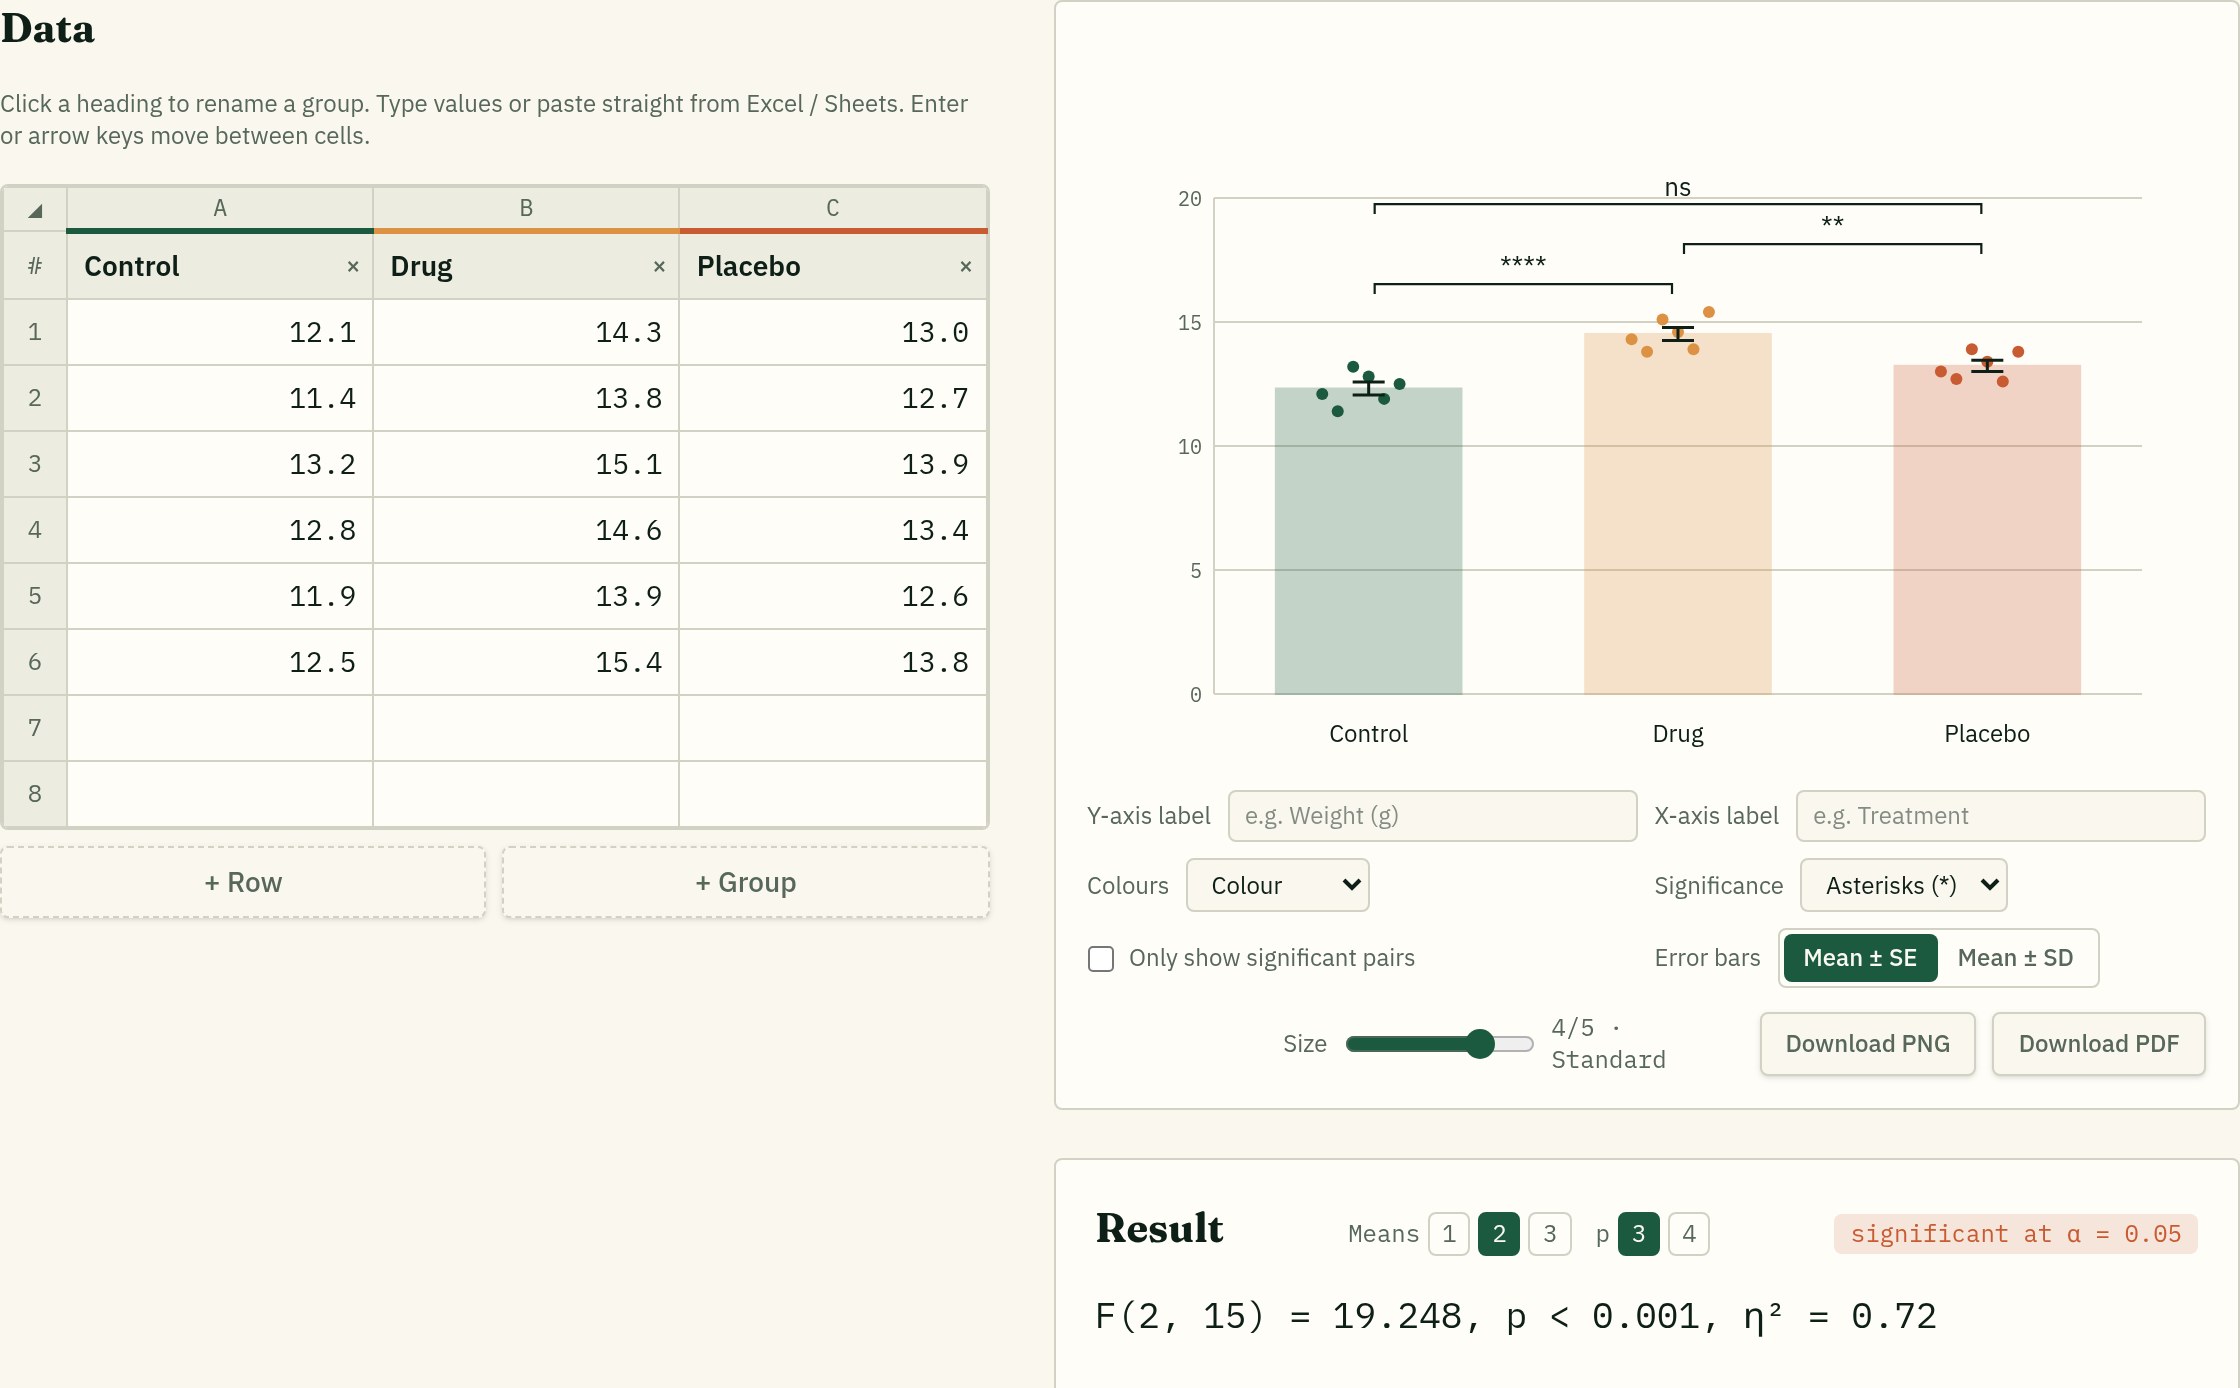
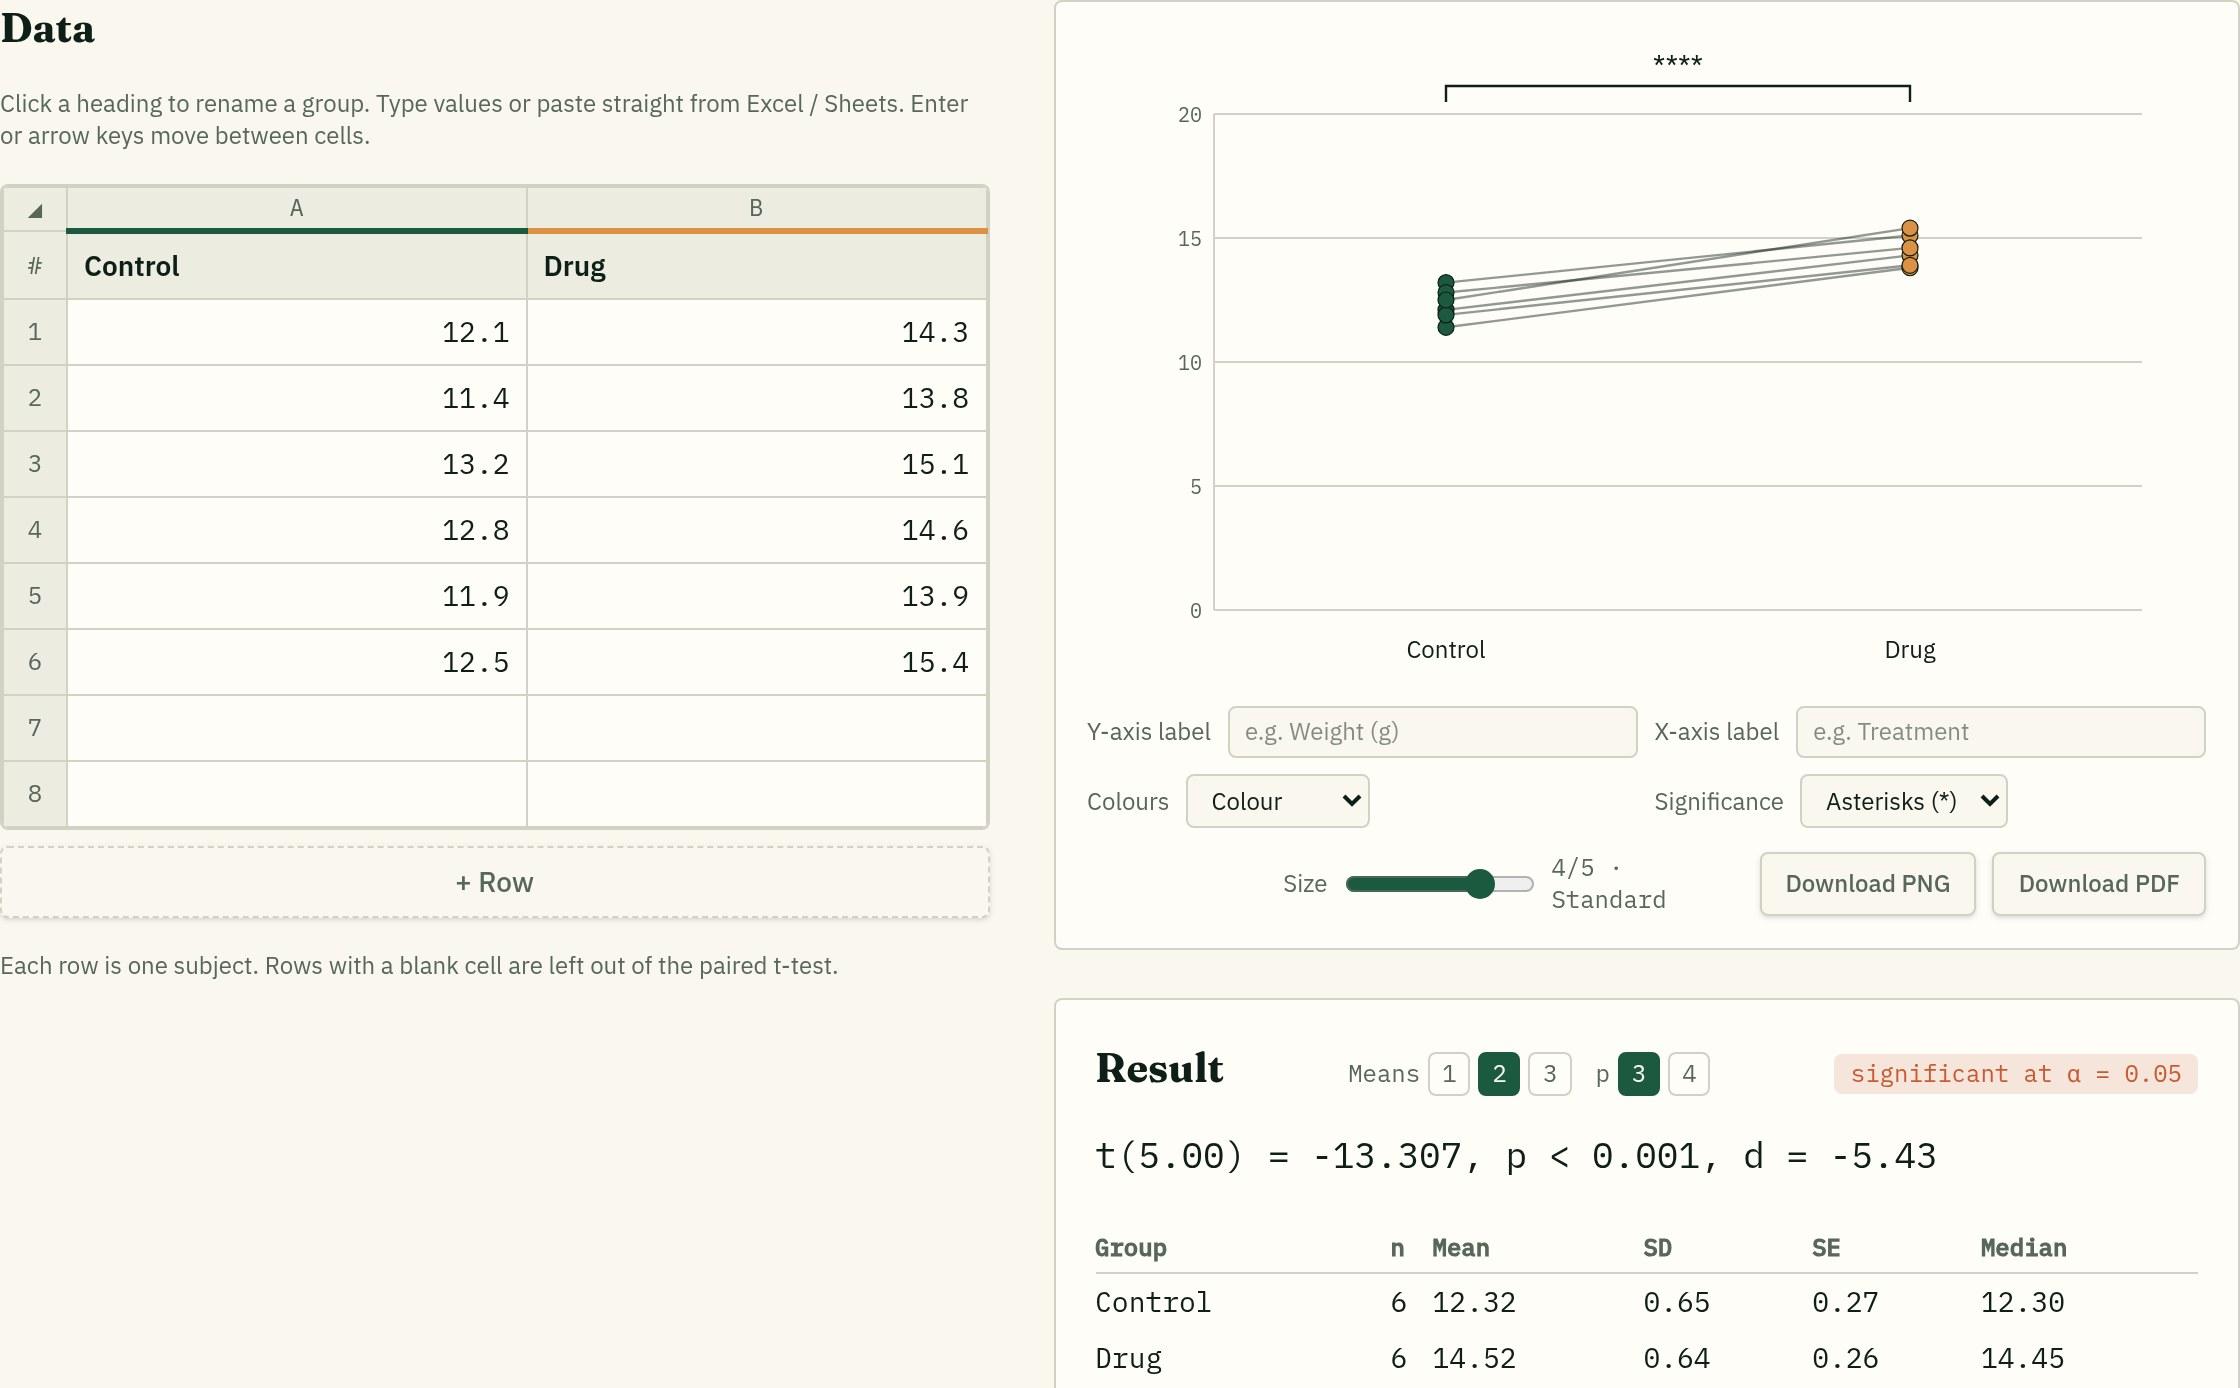
Enter your groups, pick ANOVA, and get bars with Tukey significance markers and a full results table.
Spreadsheet entry
Type or paste straight from Excel. Name your groups — Control, Drug, Week 4.
Graphs that suit the test
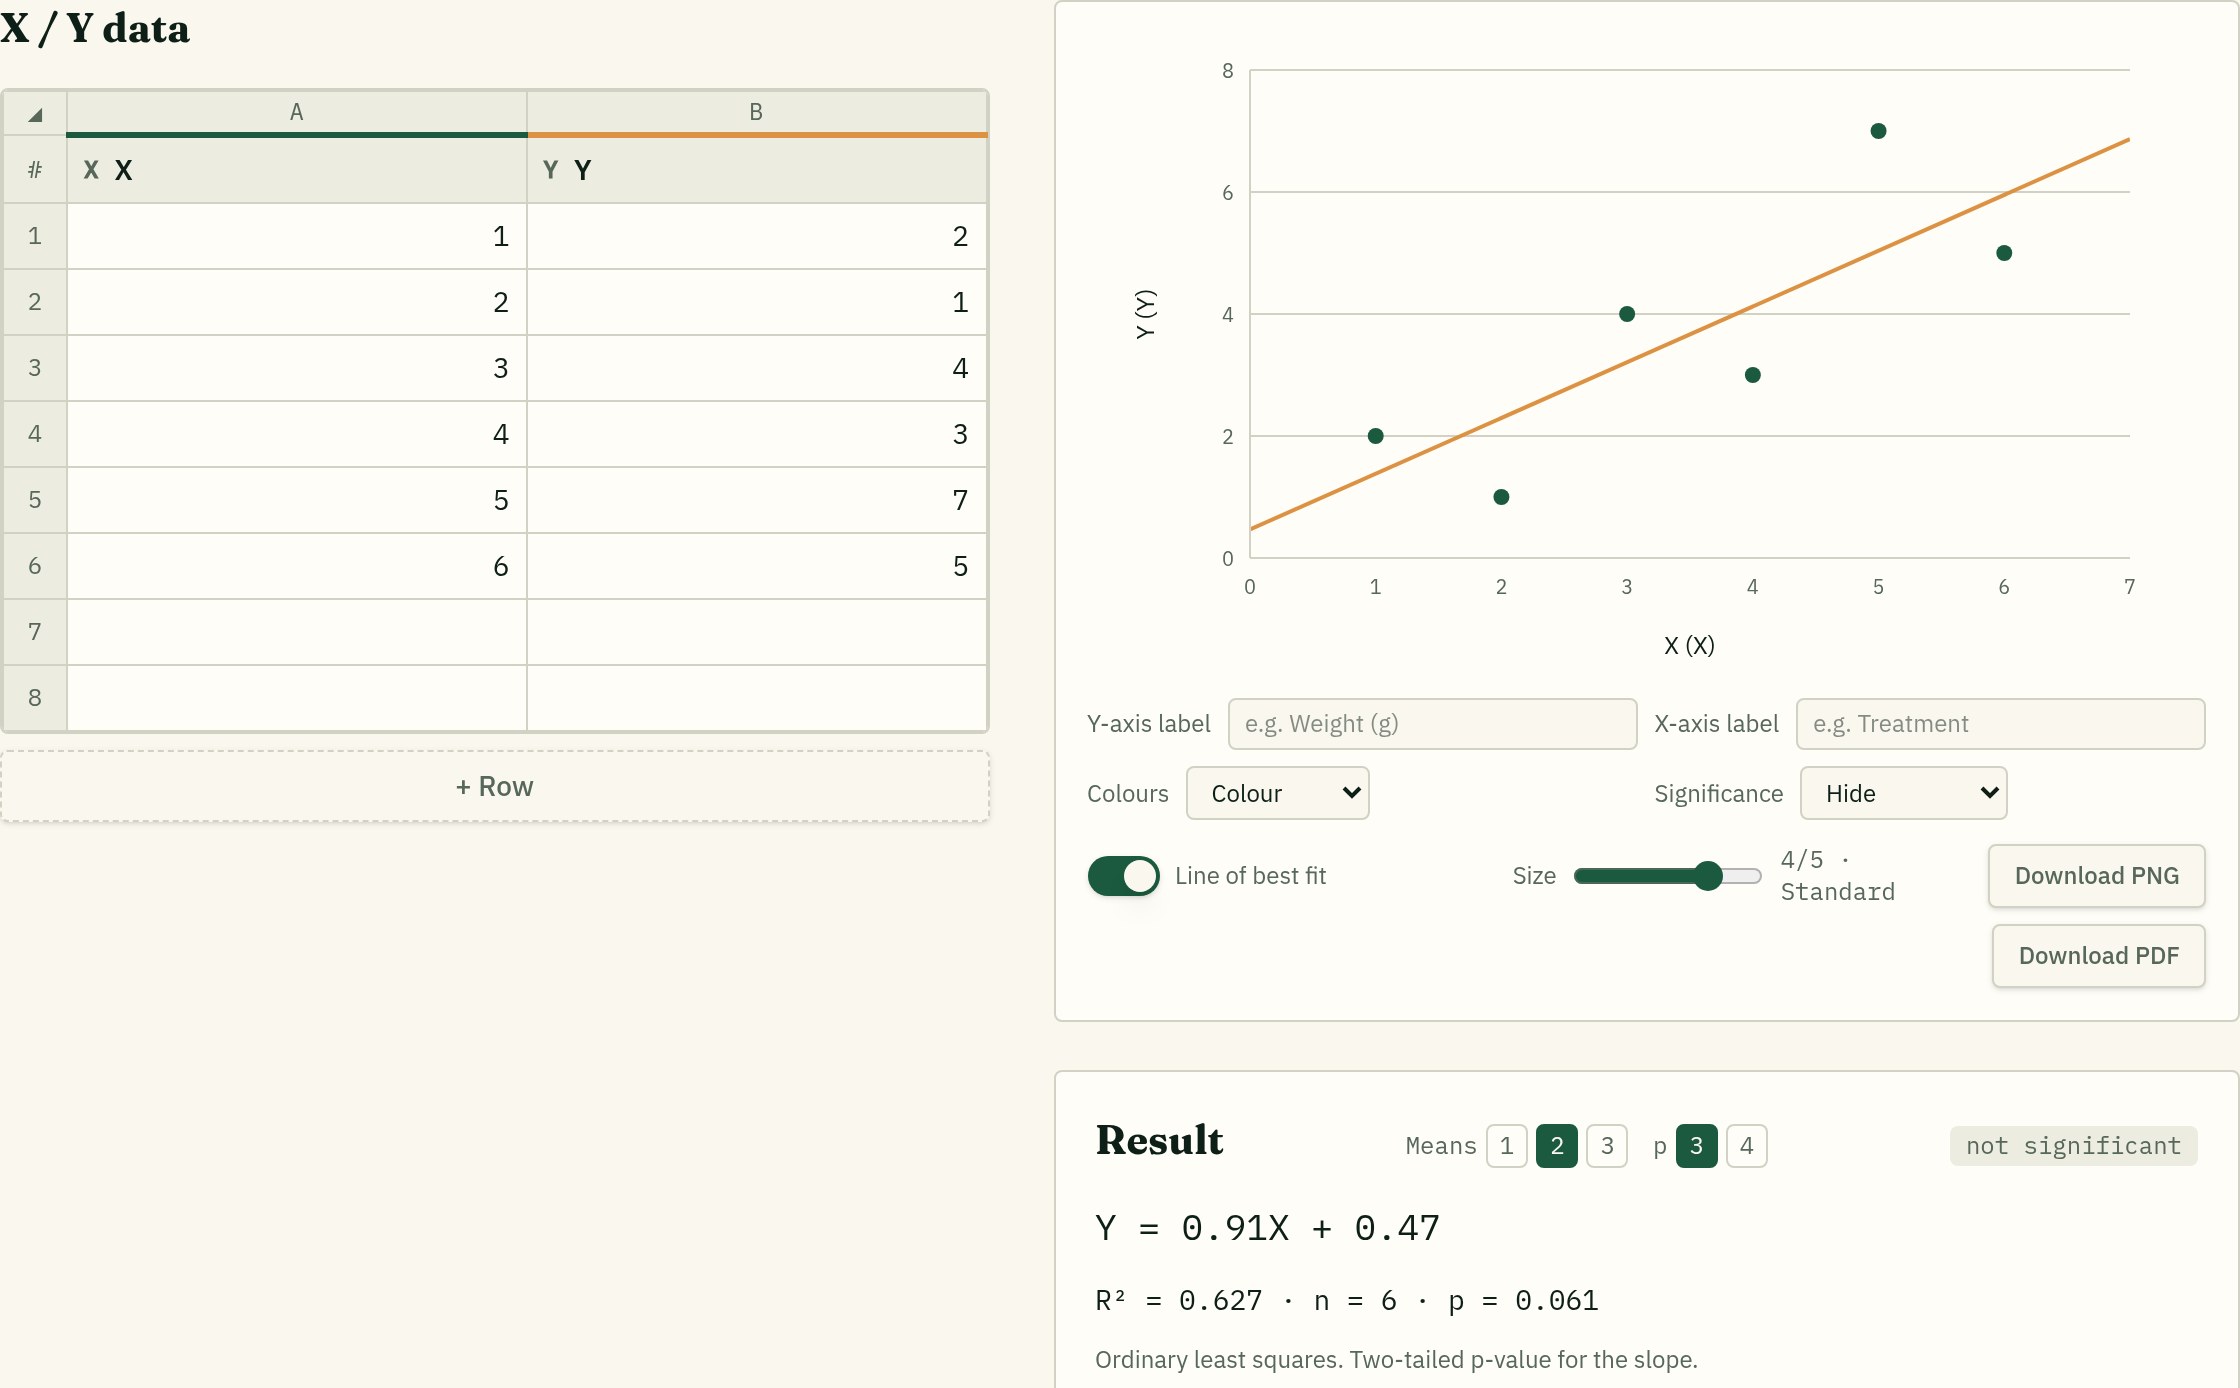
Bars with SE or SD, column scatter, box plots, joined paired dots and XY plots with a line of best fit.
Significance on the plot
Asterisks or p-values placed as tidy brackets that never overlap.
Ready for your paper
Download graphs as PNG or PDF and copy statistics with one click.
The tests
The everyday analyses behind most life-science papers, each paired with the right graph.
Comparing two groups
- Independent t-test (Welch)
- Paired t-test
- Mann-Whitney U
Comparing three or more
- One-way ANOVA
- Kruskal-Wallis
- Repeated measures ANOVA / mixed model
- Two-way ANOVA (grouped)
Pairwise follow-ups
- Tukey HSD
- Holm–Bonferroni
- Bonferroni
- Dunn's test
Relationships
- Pearson correlation
- Spearman's rank
- Linear regression
Pricing
One simple plan. Try it free for 7 days, cancel free any time.
INDIVIDUAL
£8 per month after your 7-day free trial
- ✓ 7-day free trial
- ✓ All statistical tests
- ✓ All graph types
- ✓ PNG & PDF downloads
- ✓ Cancel any time
ENTERPRISE & INSTITUTIONS
Contact us for a quote
- ✓ Everything included in INDIVIDUAL
- ✓ Group licences for teams, universities, and labs
- ✓ Invoicing
- ✓ Volume pricing